Analyzing the pre-election polls for Ghana's 2024 presidential election
1 Introduction
We analyze the major polls released ahead of Ghana’s 2024 presidential election. Of the four key polls, three were entirely inaccurate, predicting the eventual runner-up as the winner. The only poll that correctly identified the winner did so with commendable accuracy but underestimated the winner’s vote share by more than its stated margin of error.
The decisive nature of the election outcome—a 15-point margin between the winner and the runner-up—raises critical questions about how these three pollsters concluded that the runner-up would emerge victorious. While it is one thing for a poll to slightly misestimate a candidate’s vote share, it is quite another for it to predict that a candidate who ultimately won by a 15-point margin would lose by 3 points or more.
Why did the polls get it so wrong? Conventional polling methods and principles suggest that such a landslide result should not have been difficult to foresee. Our analysis explores the probabilities of the polling errors, highlights how improbable the results were given the actual outcome, and provides recommendations to improve the reliability of future polling efforts.
2 The results of the election
The following results are based on the declaration made by the Electoral Commission on December 10, 2024. In that declaration, the Electoral Commission pointed out that they had collated results from 267 out of the total of 276 constituencies. The results from the 9 outstanding constituencies are not likely to change the proportions of votes obtained by any of the candidates significantly.
| Mahama’s/NDC’s votes | 6,328,397 |
| Bawumia’s/NPP’s votes | 4,657,304 |
| Others’ votes | 205,715 |
| Total valid votes | 11,191,416 |
| Rejected ballots | 239,109 |
| Registered voters | 18,774,159 |
| Voter turnout | 60.9% |

3 What the polls predicted
The following were the predictions of the major pre-election polls that were released.
- Ben Ephson (The Daily Dispatch) predicted Bawumia would beat Mahama by a margin of 4.1 percentage points.
- Prof. Smart Sarpong (Kumasi Technical University (KsTU)) predicted Bawumia would beat Mahama by a margin of 3.3 percentage points.
- Institute of Progressive Governance (IPG), led by Prof. Isaac Boadi, Dr. George Domfe, et al., predicted Bawumia would beat Mahama by a margin of 2.9 percentage points.
- Global Info Analytics (GIA), led by Mussa Dankwah, predicted Mahama would beat Bawumia by a margin of 10.8 percentage points.
The table below shows the respective polls with their sample sizes, confidence levels, and margins of error. It also shows what the various pollsters predicted the gap between the leading contenders, Mahama (NDC) and Bawumia (NPP), was going to be.
| Pollster/polling entity | Sample size | Confidence level | Margin of error (+/-) | NDC | NPP | Others | NDC win margin |
|---|---|---|---|---|---|---|---|
| Ben Ephson | NA | NA | NA | 47.10 | 51.20 | 1.70 | -4.1 |
| Prof. Smart Sarpong | 99,355 | >99 | <1 | 45.80 | 49.10 | 5.10 | -3.3 |
| Inst. of Prog. Gov. (IPG) | 29,029 | >99 | <1 | 47.30 | 50.20 | 2.50 | -2.9 |
| Global Info Analytics (GIA) | 2,623 | 95 | 1.86 | 52.20 | 41.40 | 6.40 | +10.8 |
| Actual results | NA | NA | NA | 56.55 | 41.61 | 1.84 | +14.9 |
We make the following notes on the table.
-
All the numbers in the table, with the exception of the sample sizes, are percentages.
-
The results of Ben Ephson’s poll were announced in the Tuesday, December 3, 2024 edition of the newspaper, The Daily Dispatch. Even though the results were the front page headline of that publication, the inner page that discussed the poll did not provide the sample size, confidence level, and margin of error of the poll. Other points related to methodology were also omitted. The article however promised that the details of the poll would be provided in an upcoming book to be published by the end of January 2025.
-
The sample size, confidence level, and margin of error provided for Global Info Analytics’ poll are those of their poll released on November 18, 2024. Subsequent to that, they compiled all their polls from the preceding months to give a cumulative prediction. It is the results of this cumulative prediction that are used in the table.
4 How accurate were the polls?
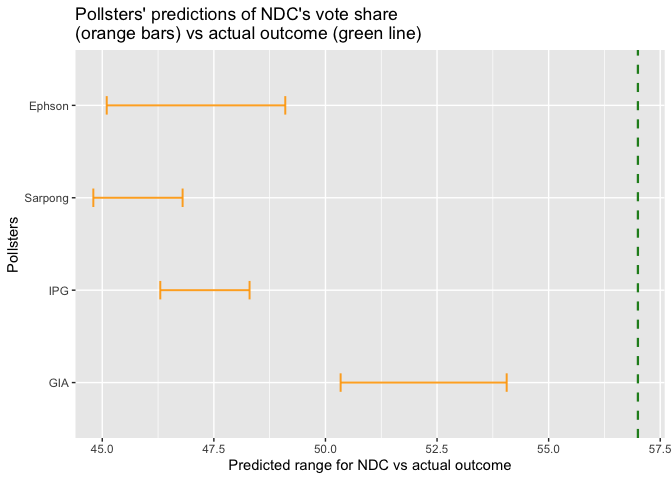
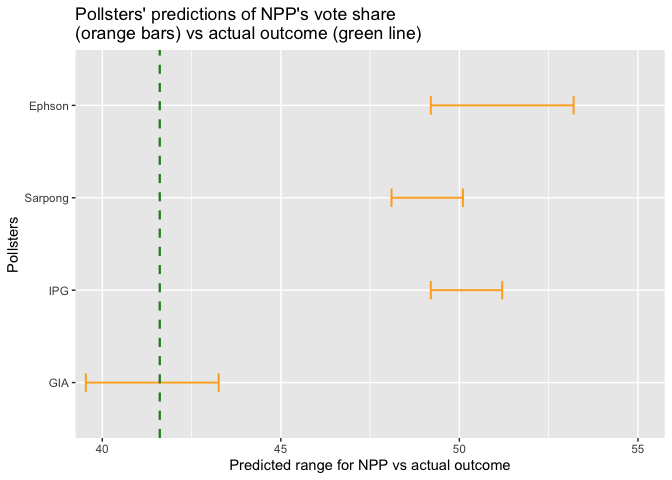
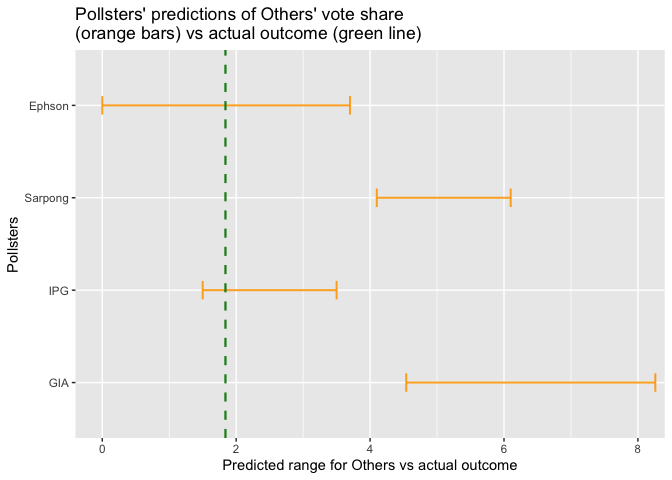
The figures below show how close each pollster’s poll or prediction came to the actual outcome for each of the parties (NDC, NPP, and Others). In each of the figures, the green vertical line represents the actual outcome while the orange bars represent the respective pollsters’ predictions of what the outcome was going to be. In other words, the orange bars show the range within which each pollster said the green line was going to fall. Thus, if a pollster’s orange bar crosses the green line, that pollster predicted the location of the green line correctly. Otherwise, he was off by the distance between the green line and the end of his bar that is closer to the green line.
Each pollster’s orange bar was obtained by adding and subtracting his margin of error from his predicted outcome. So, for instance, if a pollster said NDC was going to get 47% of the valid votes cast and his margin of error was 1%, his prediction is interpreted as “NDC will get at least 46% and at most 48% of valid votes cast.”
In the graph that shows NDC’s results, no pollster’s orange bar crosses the green line because no pollster got the percentage of votes that NDC was going to get right. However, Global Info Analytics came closest to the correct figure.
In the graph that shows NPP’s results, the green line crosses Global Info Analytics’ orange bar. That means they got the prediction right. All the other pollsters got it wrong.
In the graph that shows the results for the other contestants (apart from NDC and NPP), Ben Ephson’s and IPG’s orange bars intersect the green line. The others were farther away.
We summarize the errors made by each pollster in a table.
When the actual outcome of the elections is within a pollster’s margin of error, we conclude that that pollster correctly predicted the result. So, for instance, if a pollster predicted that a party will get 46% of valid votes cast with a margin of error of 2%, this is interpreted as “the party will get at least 44% (that is, 46% – 2%) and at most 48% (that is, 46% + 2%) of valid votes cast.” Hence, if in the actual elections the party obtains 44% of valid votes cast, that pollster is deemed to have predicted the party’s vote share correctly and his error for that prediction is 0% even though he did not predict the exact vote share of the party.
If the outcome of the election is outside the range that the pollster predicted, the error for his prediction is the distance between the lower bound of his prediction and the actual outcome or the distance between the upper bound of his prediction and the actual outcome, whichever of the two is smaller.
By this metric, Global Info Analytics obtained the least error in predicting the actual outcome while Prof. Smart Sarpong obtained the greatest error.
Since Ben Ephson did not provide a margin of error in his polling report, we supplied a generous 2% to facilitate the analysis. Also, though Prof. Smart Sarpong and IPG either published or suggested margins of error of less than 1% for their polls, we used 1% in our analysis. The errors obtained by both Prof. Smart Sarpong and IPG would have been slightly greater than what we have in the table if we had used margins of error less than 1%.
| Pollster | Margin of error | NDC | NPP | Others | NDC error | NPP error | Others error | Total error |
|---|---|---|---|---|---|---|---|---|
| Ephson | 2.00 | 47.10 | 51.20 | 1.70 | 7.45 | 7.59 | 0.00 | 15.04 |
| Sarpong | 1.00 | 45.80 | 49.10 | 5.10 | 9.75 | 6.49 | 2.26 | 18.50 |
| IPG | 1.00 | 47.30 | 50.20 | 2.50 | 8.25 | 7.59 | 0.00 | 15.84 |
| GIA | 1.86 | 52.20 | 41.40 | 6.40 | 2.49 | 0.00 | 2.70 | 5.19 |
| Actual results | 0.00 | 56.55 | 41.61 | 1.84 | 0.00 | 0.00 | 0.00 | 0.00 |
5 How difficult was it to predict the actual outcome?
Polling operates on the assumption that, at the time of the poll, voter preferences can be estimated and reflect likely election outcomes, though these preferences are subject to unpredictable change. Human beings, influenced by a range of factors such as emotions, information, and external events, can pose a challenge to this assumption. In the context of pre-election polling, when large numbers of voters change their minds between the time a poll is conducted and the time of the election, the poll’s predictive value will be compromised, especially if the changes are significant or unexpected. If no such thing happens, however, a well-designed poll that uses sound methodology, including a representative sample, proper weighting, and a sufficient sample size is expected to be effective in estimating the underlying reality. Hence, when we know the outcome of the election, we can use it as a benchmark to evaluate the methods and conclusions of the polls, keeping in mind that shifts in voter preferences between the poll and election day may impact the results.
We attempt to answer the following question:
In an election in which 56.55% of the electorate vote for NDC, 41.61% of them vote for NPP, and 1.84% vote for other candidates, what results will you get when you conduct a poll with a sample size of 200? What about 2000? What about 20,000? And then 100,000?
As an aside, the question of the sample size used in polls frequently came up in the 2024 election cycle in Ghana as politicians and their supporters routinely denigrated polls that did not favor them. It was not uncommon to hear questions like, “How can you interview only N people in an election in which 18 million people are going to vote and say you know what the outcome is going to be?”
The results we present here show that by interviewing a relatively small number of people, one can achieve remarkable accuracy in predicting elections. This accuracy becomes easier to achieve in a situation like what happened in the 2024 elections where the actual results were not close.
These facts, though known to students of statistics, are not generally known by others so it is helpful to demonstrate them by experiment. In this discussion, we use simulation to analyze the polls.
5.1 How polls are simulated
In the simulations, we assume there is a large population (e.g., the number of registered voters, 18.77 million) of which 56.55% prefer NDC, 41.61% prefer NPP, and 1.84% prefer other candidates. We then randomly select the number we want to poll or interview. Hence, for example, if our sample size is 200, we randomly select 200 people from this large population. By random we mean that the probability that any set of 200 people is selected is the same. After selecting our sample, we sort them into how many people prefer each of the three candidates, NDC, NPP, and Other, and calculate the percentages for each of the parties. We also calculate the difference between the percentage of votes NDC got and what NPP got for further analysis.
In the appendix we delve into the implementation details for the simulations, including the programming language, functions, and other details.
5.2 Observations from simulated polls with a sample size of 200
We simulate 10 polls with a sample size of 200 and present the results.
| Poll 1 | Poll 2 | Poll 3 | Poll 4 | Poll 5 | Poll 6 | Poll 7 | Poll 8 | Poll 9 | Poll 10 | |
|---|---|---|---|---|---|---|---|---|---|---|
| NDC | 54.5 | 59.0 | 53 | 58.5 | 55.5 | 58.0 | 56.5 | 59.5 | 62.0 | 49.5 |
| NPP | 43.5 | 39.5 | 45 | 38.5 | 42.0 | 40.5 | 41.5 | 37.5 | 36.5 | 47.0 |
| Others | 2.0 | 1.5 | 2 | 3.0 | 2.5 | 1.5 | 2.0 | 3.0 | 1.5 | 3.5 |
| NDC - NPP | 11.0 | 19.5 | 8 | 20.0 | 13.5 | 17.5 | 15.0 | 22.0 | 25.5 | 2.5 |
From the results of 10 polls with a sample size of 200, we make some observations.
-
NDC wins in all of them.
-
In poll 10, NDC wins but with less than 50% of the votes. That would suggest a runoff since the winner needs more than 50% for an outright win.
-
In 8 of the polls, the gap between NDC is in the double digits (10% or more). In 2 of them, poll 3 and poll 10, the gap is below 10%. In poll 10, the gap is relatively small (2.5%).
What we can conclude from these simulations is that, given the underlying reality of the outcome of the 2024 elections, if one had conducted a poll with a sample size of 200, he would have been able to predict quite confidently that NDC will win. Since polls with sample size 200 are relatively cheaper and faster to run than larger polls, many of such polls could have been conducted to estimate the outcome of the actual election.
We are going to simulate one million polls with sample size 200 and plot the differences between the proportion of votes NDC gets and what NPP gets.
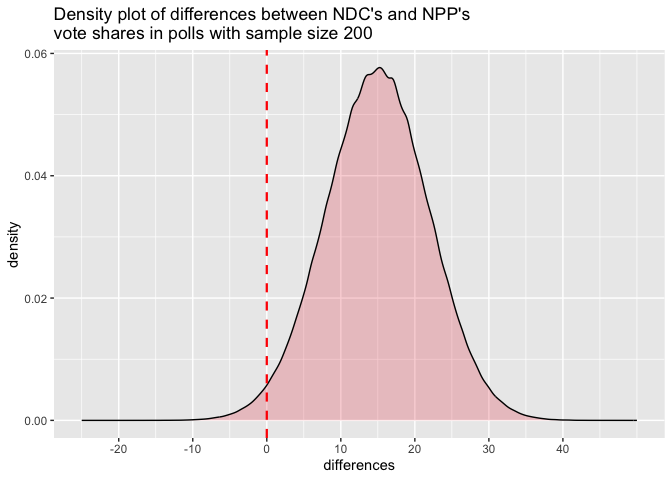
Doing so yields the density curve above. The shape of the curve is the famous bell curve, which is the density function for the normal distribution. This is what we would expect according to the central limit theorem. The mean of the differences is 14.92 while the standard deviation is 6.93.
From the density plot, we can see that most of the differences (about 98.24% of them) are greater than 0 (to the right of the red vertical line). Since a difference greater than 0 implies NDC got more votes than NPP, this result shows that if we were to conduct a poll with sample size 200, about 98.24% of the time, we would correctly predict that NDC will beat NPP and the remaining 1.76% of the time we would make the wrong prediction. That’s impressive for a poll of just 200 people predicting the behavior of 18.8 million registered voters.
5.3 Simulating polls with larger sample sizes
We run the experiment for larger sample sizes—2,000, 20,000, and 100,000—to estimate the probabilities of getting a poll that leads us to the wrong prediction. We also include the results we get when we run the experiment for the sample sizes Prof. Smart Sarpong, Institute of Progressive Governance (IPG), and Global Info Analytics (GIA) used. These sample sizes are 99,355 for Prof. Smart Sarpong, 29,029 for IPG, and 2,623 for GIA. For each sample size, we simulate one million polls to get some statistics on the outcomes.
| Sample size | Mean diff | Std. dev. | n(diff <= 10) | n(diff <= 5) | n(diff <= 0) | n(diff <= -2.5) |
|---|---|---|---|---|---|---|
| 200 | 14.916 | 6.9271 | 250,033 | 82,005 | 17,558 | 6,904 |
| 2,000 | 14.933 | 2.1903 | 12,503 | 2 | 0 | 0 |
| 2,623 | 14.934 | 1.9116 | 5,052 | 0 | 0 | 0 |
| 20,000 | 14.932 | 0.69315 | 0 | 0 | 0 | 0 |
| 29,029 | 14.932 | 0.57504 | 0 | 0 | 0 | 0 |
| 99,355 | 14.932 | 0.31052 | 0 | 0 | 0 | 0 |
| 100,000 | 14.932 | 0.30924 | 0 | 0 | 0 | 0 |
From the table, when the sample size is 200, out of one million polls, 17,558 give us a difference (NDC percentage minus NPP percentage) that is less than zero. In other words, in 17,558 of the one million polls, NDC gets a smaller proportion of the votes than NPP does, a result which contradicts the results of the actual election. Thus, the probability of making a wrong prediction when we conduct a poll with a sample size of 200 is 17,558/1,000,000, which is about 1.76%. In the remaining 98.24% of the polls, we correctly predict that NDC will win even though with varying degrees of accuracy for the proportion of votes each party will get.
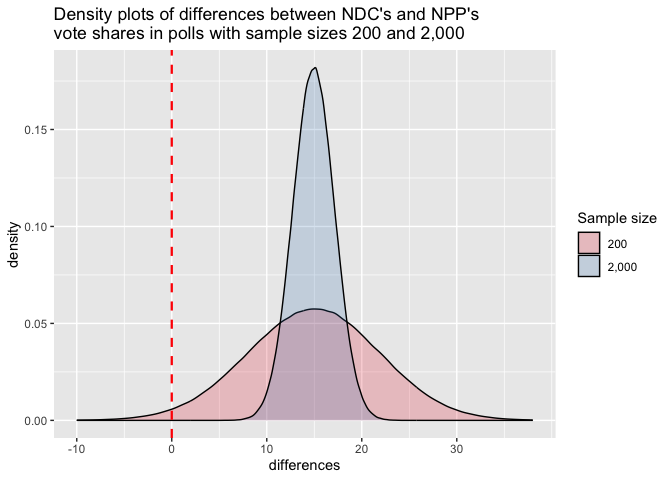
When the sample size increases to 2,000, the density curve sharply narrows, meaning that most of the results we get from the polls are much closer to the true proportions than they were when we were dealing with sample sizes of 200. The density curve for sample sizes 200 and sample sizes 2,000 are shown on the same graph for comparison. Both density curves peak at the mean value of about 14.92 but the spread of the curve around that value differs between the two curves.
For the curve for sample sizes 200, there is more spread about the mean, indicating a higher probability that the estimate the poll gives will exhibit a large deviation from the actual result. However, when the sample size is increased to 2,000, the probability of a large deviation of the estimate from the actual decreases and we see smaller differences between the proportions predicted and the actual proportions.
Further, we note that though a small amount of the area under the curve for the sample size 200 polls lies to the left of the red line, virtually none of the area under the curve for the sample size 2,000 polls lies to the left of the red line. Indeed, when we take a look at the table, we see that none of the polls with sample size 2,000 gives a difference less than 0. That means if we were to run polls with that sample size, we would always predict that NDC will win. From the same table, we see that only 2 out of one million polls with sample size 2,000 give a difference less than or equal to 5. This means that practically every poll with sample size 2,000 should tell us that NDC will win with a margin of at least 5%
In fact, only 12,503 (about 1.25%) out of the one million polls with sample size 2,000 give a difference or margin of victory for NDC that is less than or equal to 10%. All the remaining 98.75% of the polls point to a margin of victory greater than 10%.
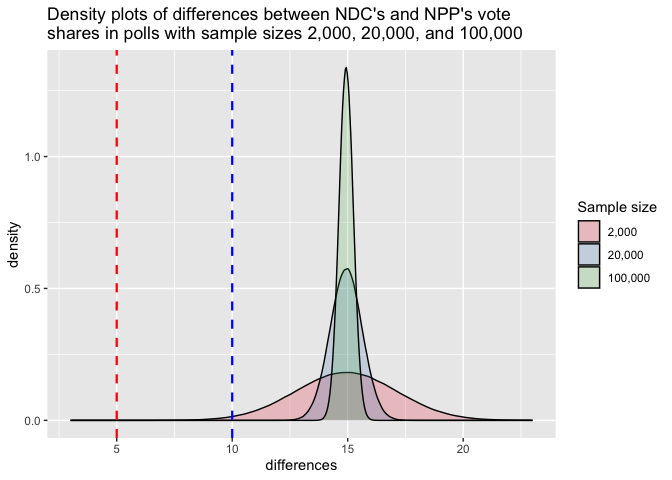
When we increase the sample size to 20,000, the table says that all the one million polls say NDC will win with a margin of at least 10 percentage points. This is also shown in the graph, where we see that all the area under the density curve for the polls with sample size 20,000 is to the right of the blue vertical line.
By the time we increase the sample size of the polls to 100,000, we have so narrowed the possibilities around the true value that it is practically impossible to get any result other than that NDC will win by a margin of about 15 percentage points.
6 How unlikely were the predictions the pollsters gave?
The portions of the table above that are relevant to the discussion in this section have been extracted here.
| Pollster | Sample size | Mean diff | Std. dev. |
|---|---|---|---|
| GIA | 2,623 | 14.934 | 1.9116 |
| IPG | 29,029 | 14.932 | 0.57504 |
| Sarpong | 99,355 | 14.932 | 0.31052 |
As we noted earlier, Prof. Smart Sarpong’s prediction was that NPP will win by a margin of 3.3% while IPG predicted NPP will win by a margin of 2.9%. Comparing these with the actual result, which was about a 15% margin of victory for NDC, Prof. Smart Sarpong’s prediction was off by a margin of more than 18% while that of IPG was off by a margin of more than 17%. To simplify the analysis, we will use the smaller error margin of 17% for both pollsters. We are unable to discuss Ben Ephson’s poll in this part of the analysis because he does not provide a sample size.
An error of 17 percentage points may be large in absolute terms but it is even more significant and alarming statistically. From the table above, the standard deviation of the results of a poll with the sample size that IPG used (29,029) is about 0.58 while that for the sample size that Prof. Smart Sarpong used (99,355) is about 0.31. Thus, a 17-point deviation from the expected value (the actual outcome of the election) is equivalent to a deviation of 17 / 0.58 = 29.31034 standard deviations in the case of IPG, and a deviation of 17 / 0.31 = 54.83871 standard deviations in the case of Prof. Smart Sarpong.
Deviations of that magnitude are unheard of when dealing with normally distributed random variables as we are in this case. Even a deviation of 6 standard deviations below the expected value or worse is extremely rare, having probability less than one in a billion. We present a few of the relevant probabilities below.
Given that a random variable \(X\) follows a normal distribution with mean 0 and standard deviation \(\sigma\), the following probabilities hold:
\[\begin{align*} P(X \leqslant -6\sigma) &= 9.865876 \times 10^{-10} \\ P(X \leqslant -29\sigma) &= 3.289785 \times 10^{-185} \\ P(X \leqslant -54\sigma) &= 0 \end{align*}\]Thus, assuming the underlying reality of the outcome of the 2024 presidential elections, the probability of obtaining IPG’s result when one runs a poll with the sample size they used is \(P(X \leqslant -29\sigma) = 3.289785 \times 10^{-185}\). The probability of obtaining Prof. Smart Sarpong’s result when one runs a poll using his sample size is \(P(X \leqslant -54\sigma) = 0\). The value was too small to register on our computer. The rarity of these results suggests that something must have gone radically wrong with the pollsters’ methods and processes.
7 The pollsters’ reflections on their polls
7.1 The reasons offered for the failed predictions
The foregoing assessments show that an outcome such as the one witnessed in the 2024 presidential elections should have been easy to predict using scientific polling. The fact that all but one of the major polls got the prediction completely wrong raises serious questions about the credibility of those polls. Granting a good faith effort by the pollsters to predict the outcome of the election, we are left with no choice but to attribute the abysmal performance of the polls to bad methodology, faulty processes, and other such factors within the control of the pollsters.
Interestingly, two of the pollsters whose predictions failed think otherwise. In an interview on Joy FM, Ben Ephson attributed his failed prediction to low turnout fueled by voter apathy. He argued that polls cannot detect apathy, hence, in such a scenario, no poll could have correctly predicted the eventual outcome.
Incidentally, Prof. Smart Sarpong, in an interview on Angel FM, also cited apathy for why his poll failed. He argued further that his poll was only a snapshot of the state of affairs several weeks before the election and that actions the political parties took subsequent to his polls are what altered the results.
We find it disturbing that neither of these pollsters attributed their wrong predictions to their processes or methodologies especially since one of the major public polls (the one from GIA) came much closer to the actual result than either of them did.
While commenting on the performance of their poll on Vimlady Online, Dr. Domfe of IPG blamed their poll’s failure on their interview questions not having been robust enough to detect the true intentions of voters. He mentioned that though previous polls they had conducted in the run-up to the 2024 elections had indicated widespread voter apathy among NPP sympathizers and a win for NDC, their last poll showed a reversal of that trend and a win for NPP, hence their prediction that NPP was going to win.
7.2 GIA’s explanation for why it missed NDC’s vote share
Even though GIA correctly predicted NPP’s vote share (predicted: 41.4%, actual: 41.61%) and the major feature of the election, that is, that NDC was going to win by a wide margin (predicted margin of victory: 10.8%, actual: 14.9%), they underestimated NDC’s vote share (predicted: 52.2%, actual: 56.55%) and overestimated the vote shares for the independent candidates Nana Kwame Bediako (predicted: 3.0%, actual: 0.75%) and Alan Kwadwo Kyerematen (predicted: 2.5%, actual: 0.28%). So far in our discussion, we have aggregated the votes for all the candidates other than the candidate for the NDC and the NPP under the umbrella category “Others” but we have separated out the vote shares for Nana Kwame Bediako and Alan Kwadwo Kyerematen here for the purposes of the discussion in this section.
In an interview on Royal Television (RTV), Mussa Dankwah, the executive director of Global Info Analytics (GIA) attributed GIA’s underestimation of Mahama’s (NDC’s) vote share and its overestimation of Bediako’s and Kyerematen’s vote shares to a belated decision of voters to shift their votes from Bediako and Kyerematen to Mahama (NDC) so as to ensure an emphatic win for the NDC in the first round and ward of any possibility of a runoff. According to him, the voters who did this actually preferred the two independent candidates but did not want to take any chances in their quest to vote the NPP out of office.
When asked about voter apathy in the Ashanti Region being the cause of the disappointing vote share the NPP obtained in that region, he dismissed that argument, opining that if the apathetic voters in that region had voted, they would have voted just like the others who voted did. Thus, the apathetic voters would only have changed the vote counts but not the percentages the various candidates obtained.
8 Desiderata for election forecasting
We discuss some ideas for improving the quality of polls in future election cycles.
8.1 More independent polls
The media houses and other civil society organizations should get involved, commissioning their own polls or contracting credible polling agencies to do so on their behalf.
8.2 More regional or local polls
Targeted polling of smaller portions of the electorate will yield keener insights into voter behavior and choices. Because such polls are likely to have higher degrees of accuracy, they can serve as a check on larger polls that have fewer resources to spend on any particular subsection of the electorate.
8.3 More frequent polls
The more frequently one conducts a given poll, the more insight he gets into what the issues and potential problems with his work might be. Hence, rather than running a single poll with a sample size of, say, 100,000, it may be better to conduct many smaller polls, affording the researcher the opportunity to refine his own methods as he gathers insights into the practical issues that arise in the field. As the analysis above showed, a poll with a sample size of 2,000 can yield many of the same insights that one with a much larger sample size could.
8.4 More transparency on methods and data
The polling industry in Ghana should hold itself to higher standards than those that currently prevail. For example, it should be unacceptable to publish the results of a poll as the main headline on the front page of a newspaper and not provide any details on methodology, sample size, margin of error, and confidence level in the inner pages. Further, written reports on the basic details of a poll should be provided as part of the announcement of polls. It is now customary for pollsters to be given airtime to discuss their polls but that should not be the extent of the information dissemination. Finer details should be provided on public websites to facilitate more critical analysis of the work done.
9 References
Electoral Commission’s declaration of the results
- From UTV Ghana Online: https://www.youtube.com/watch?v=uxjbeDCvcnU
Statistics on registered voters
- https://www.myjoyonline.com/here-are-key-highlights-from-ipac-meeting-of-15th-october-2024/
- https://citinewsroom.com/2024/10/breakdown-of-statistics-on-revised-provisional-voters-register/
Global Info Analytics polling reports
- Final national poll released on November 18, 2024: https://onedrive.live.com/?authkey=%21AJhWAB8yFpPbBFQ&id=E1B11D01E64A3039%2122278&cid=E1B11D01E64A3039&parId=root&parQt=sharedby&o=OneUp
- Presidential elections and parliamentary seats forecast released on November 29, 2024: https://onedrive.live.com/?authkey=%21AOmo8hDGNChi0o0&id=E1B11D01E64A3039%2122475&cid=E1B11D01E64A3039&parId=root&parQt=sharedby&o=OneUp
Prof. Smart Sarpong polling report
Institute of Progressive Governance (IPG) poll presentation
-
By Dr. George Domfe on Net2TV GH: https://www.youtube.com/watch?v=CsFHRw0Hqnk&t=5132s
-
By Dr. Eric Boachie-Yiadom on Metro TV Ghana: https://www.youtube.com/watch?v=QY5IaYfowtQ
The pollsters’ reflections on their pollls
- Ben Ephson on Joy FM: https://www.myjoyonline.com/ben-ephson-explains-why-his-election-prediction-failed-again/
- Prof. Smart Sarpong on Angel FM: https://www.youtube.com/watch?v=yr8XZrHqzlI
- Mussa Dankwah on Royal TV (RTV): https://www.youtube.com/watch?v=necyeTyaR6c
- Dr. George Domfe on Vimlady Online (Okay FM): https://www.youtube.com/watch?v=R46WFqJYlPg
10 Appendix
This portion of the paper discusses technical, theoretical, and implementation details that are unlikely to appeal to the general audience for whom the rest of the paper was written. It is added here for completeness and to answer the questions that are likely to emerge in the minds of those who would like to build upon this work, replicate it, or take inspiration from it for other projects.
10.1 Code, data, and markup
We used the R programming language extensively in this paper. We have made all the code and markup for the simulations, plots, tables, and the entire paper available on Github to encourage others to experiment and contribute to the discourse. All the data we used is also available at the same address.
Some of the documents cited are also available online on Google Drive
10.2 The sampling scheme used in the simulations
One matter we had to decide in the simulations was whether to sample with or without replacement. When polling, one samples without replacement—we don’t want to interview a person more than once. However, the probability of choosing somebody more than once from a large population in a random sample is low when the sample size is small compared to the size of the entire population. Hence, it does not make a material difference whether the sampling is done with or without replacement.
To sample with replacement, all you need is the proportions of votes the respective candidates obtained. However, to sample without replacement, you need the actual numbers of people in the population that fall into each category. So, in our case, for example, you would need to know how many people voted for NDC, for NPP, and for Others. You would also have to consider what to do about rejected ballots. You may choose to ignore them or distribute them to the respective candidates according to the proportion of valid votes they obtained.
To simplify the discussion, we sampled with replacement.
10.3 Sampling with replacement
We used the function which returns random variates from the multinomial distribution with the probabilities of the respective categories specified. It takes three arguments: the number of random variates we want or how many times we want to draw from the distribution, the quantity or size of our draws, and the probabilities of drawing from the different categories or classes.
To use to simulate drawing a sample of size 200 from a population of voters in which 60% vote for party A, 38% vote for party B, and 2% vote for party C, we could use where
- The first argument, 1, represents how many times we want to do experiment or how many instances of the request we want to make.
- The second argument, 200, is the number of people we sample.
- The last argument, , represents the frequencies of the different categories in our population. It can be any list of positive numbers. They are eventually scaled to become probabilities summing to 1. Thus, we could have used or and got the same result.
10.4 Sampling without replacement
To sample without replacement, one could use the function for the multivariate hypergeometric distribution from the extraDistr library.
Then, we can sample without replacement from the population of those who are going to vote by calling where
- The first argument, 1, is the number of times we want to perform the experiment.
- is a vector like which represents the vote shares of three candidates. Here, the first candidate got 6 million votes, the second got 4 million, and the third got 200,000.
- is the number of people we want to draw out of the population for interviews in our poll.
10.5 Proof that it does not hurt to sample with replacement
When \(n\) people are sampled or chosen from a population of size \(N\) with replacement, what is the expected number of people who will be chosen more than once?
Let the random variable \(X\) be the number of people out of the total population of size \(N\) who are chosen more than once. We want to compute the expected value of \(X\), \(E(X)\).
We define an indicator random variable \(I_j\) for each of the \(N\) persons in the population as follows.
\[\begin{equation*} I_j = \begin{cases} 1, & \text{if person $j$ is chosen more than once} \\ 0, & \text{otherwise} \end{cases} \end{equation*}\]Then \(X = \sum_{j = 1}^{N} I_j\) and \(E(X) = \sum_{j = 1}^{N} E(I_j)\) by linearity of expectation.
Thus, to compute \(E(X)\), we need to first compute \(E(I_j)\). Noting that
\[E(I_j) = P(\text{person $j$ is chosen more than once}),\]we proceed to compute \(P(\text{person $j$ is chosen more than once})\).
Every person is either never chosen, chosen exactly once, or chosen more than once. Hence,
\[P(\text{person $j$ is chosen more than once}) = 1 - P(\text{person $j$ is never chosen}) - P(\text{person $j$ is chosen exactly once})\]If we have to choose one person out of \(N\) people, the probability that a particular person, say person \(j\), is chosen is \(1/N\). Hence, the probability that he is not chosen is \(1 - 1/N\).
If we choose \(n\) times, then the probability that person \(j\) is not chosen in any of those \(n\) selections is
\[P(\text{person $j$ is never chosen}) = \left( 1 - \frac{1}{N} \right)^n.\]To calculate the probability that person \(j\) is chosen exactly once, we can consider the number of ways in which this event could occur. He could be chosen the first time we make a selection and no other time, or he could be chosen the second time we make a selection and no other time, or the third time we make a selection and no other, and so on. The probability of each of those \(n\) mutually exclusive possibilities is \(( 1/N ) (1 - 1/N )^{n - 1}\). Hence, we multiply by \(n\) to get the total probability of the \(n\) events as
\[P(\text{person $j$ is chosen exactly once}) = n \left( \frac{1}{N} \right) \left(1 - \frac{1}{N} \right)^{n - 1}.\]Hence, the probability that person \(j\) is chosen more than once is
\[\begin{align*} P(\text{person $j$ is chosen more than once}) &= 1 - \left( 1 - \frac{1}{N} \right)^n - n \left( \frac{1}{N} \right) \left(1 - \frac{1}{N} \right)^{n - 1} \end{align*}\]This probability holds for any \(j\). Hence,
\[E(X) = \sum_{j = 1}^{N} E(I_j) = \sum_{j = 1}^{N} E(I_1) = N \cdot E(I_1) = N \left( 1 - \left( 1 - \frac{1}{N} \right)^n - n \left( \frac{1}{N} \right) \left(1 - \frac{1}{N} \right)^{n - 1} \right)\]In our case, \(N\) is the size of the population—the number of registered voters—while \(n\) is the sample size. We compute \(E(X)\) for \(N = 18.77 \times 10^6\) and some values of \(n\) to see what we get.
| Sample size (n) | Number repeated | Percentage (%) |
|---|---|---|
| 200 | 0.001060327 | 0.0005301633 |
| 2,000 | 0.1064935 | 0.005324675 |
| 20,000 | 10.64722 | 0.05323608 |
| 100,000 | 265.4357 | 0.2654357 |
From the above, we see that when we sample the sample sizes listed with replacement from a population of about 18.77 million, the expected number of people who will be interviewed more than once is so small as to be immaterial to the analysis. Hence, it does not matter whether we sample with or without replacement.
If in spite of the foregoing one still objects to our using this sampling scheme, we note that if our weaker sampling scheme was able to produce the remarkable results we demonstrated, that only strengthens our thesis that the election was so lopsided that virtually any sampling scheme remotely resembling random could have detected who the winner was going to be, making it all the more surprising that the polls were so disappointing.